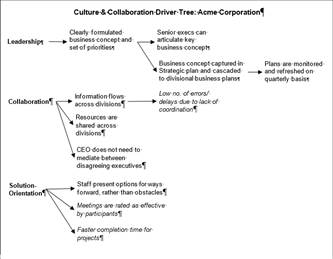
Many of these observable differences can be measured – these are italicised. Of the others, many are binary and can be captured in simple Yes/No indicators (is there a clearly formulated concept of the business or not?).
Note too that some aspects (solution-orientation) only required one step to become observable, whereas others (leadership) needed three.
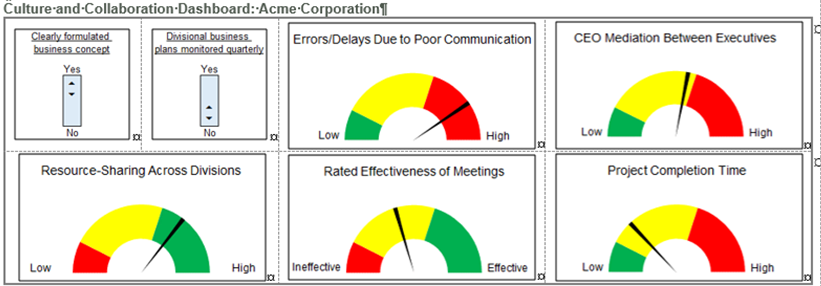
The Culture & Collaboration Dashboard
But the fun doesn’t end there. (In fact it’s just beginning …).
We can portray these indicators on what I call a Culture & Collaboration Dashboard – an at-a-glance representation of key soft factors an organisation wishes to monitor and influence. Here’s what this might look like for a selection of Acme Corporation indicators once they have collected data based on their driver tree analysis:
(Click on the image above to open a larger pdf version).
Read in conjunction with the driver tree, this shows us that while Acme has a formulated business concept in place, it hasn’t been cascaded into a process that is regularly monitored at the divisional level. Making this happen is a key imperative in fostering Leadership.
Performance on the Collaboration dimension is mixed: there are large numbers of errors due to poor communication, and the CEO is very nearly spending too much time playing ‘parent’ between rival executives. Divisions are, nonetheless sharing resources. Focus needs to be directed to enhancing communication (possibly utilising the staff who are working across divisions).
Solution-orientation is holding steady: meeting effectiveness needs to be watched, but project completion time is in good shape.
We now have a first-pass at an integrated picture of ‘soft’ cultural factors; Acme can derive from this a clear set of areas in which to focus attention.
Collaborating to Define Collaboration
It’s often seen as a difficulty in dealing with soft factors such as collaboration and leadership that they are subjective and can’t be defined with the precision that, say, a person’s blood pressure can be measured. This is true: a measure of collaboration (say) is relative to how we define it, so we have to make sure our definition is as meaningful as we can make it.
However, there is an advantage lurking in this: it forces an executive team to spend the time properly defining what they understand these factors to look like. Once there is a clear and agreed definition of collaboration, the organisation can get to work establishing counting rules and collecting data.
Following that, and after some serious data collection, ambitious organisations can apply rigorous analytical techniques such as multiple regression to determine which of the factors in their driver trees have genuine explanatory power, and which are extraneous. And to relate the soft factors to the hard factors of revenue, cost, defect rates, and the like. But that’s down the track …
In the interim, I invite you and your leadership team to systematically think through what are the ‘fuzzy people issues’ on which your success depends, and then go the next step to defining, measuring and displaying them on a Culture & Collaboration Dashboard.
I would be delighted to hear your progress; if you’d like some assistance please drop me a line.
Kind regards,
Michael
Director I Michael Carman Consulting
PO Box 686, Petersham NSW 2049 I M: 0414 383 374
References:
Douglas W. Hubbard (2010) How to Measure Anything: Finding the Value of "Intangibles" in Business John Wiley & Sons.
© Michael Carman 2016