CRACKING THE CODE OF CUSTOMER SATISFACTION - PART 2
We saw last month how to dig into customer satisfaction data to find out which aspects are most closely linked to overall customer satisfaction.
You might recall we analysed the customer satisfaction attributes from a fictitious case study shown in this graph …
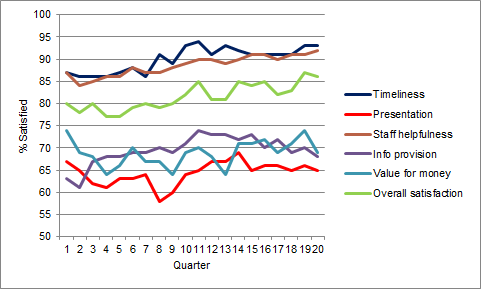
… and used correlations to find which ones move together. We saw that staff helpfulness was most closely linked to overall customer satisfaction, and that timeliness was in turn linked to staff helpfulness.
A powerful technique known as regression enables us to take the analysis even further. I ran a regression on this data and found that …
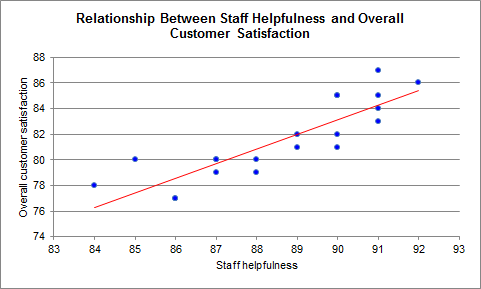
- of all the attributes, staff helpfulness was confirmed as the attribute which can be used to explain and predict overall customer satisfaction
- 75 percent of the variation in overall customer satisfaction can be accounted for by the variation in staff helpfulness
- a one point increase in staff helpfulness is associated with a 1.1 point increase in overall customer satisfaction, and
- the likelihood that this relationship is due to chance – a fluke – is very low (less than 1 percent).
So a rise in staff helpfulness creates a bigger increase in overall customer satisfaction than the initial increase! (1.1 point rise in overall customer satisfaction from a 1.0 point rise in staff helpfulness).
That’s a lot of information to winnow from one set of data.
If we plot staff helpfulness against overall customer satisfaction it looks like this:
Taking it Further
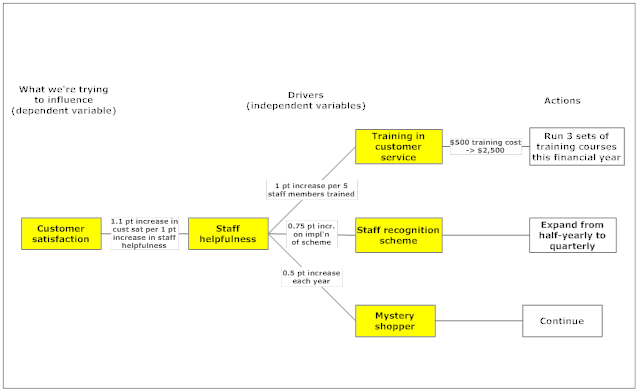
The benefits we gain from this information don’t stop there: we can use and extend the analysis in smart ways to guide our actions and make tangible improvements in our organisations: for example if it costs $500- per person to train staff in customer service, and training 5 staff is associated with a 1 point increase in staff helpfulness (something which we could also establish through a regression analysis) then we can see that it costs $2,500- (5 x $500) to get a 1.1 point gain in overall customer satisfaction. That’s a very useful, actionable finding.
Too many organisations operate in a fog and settle for plain exchanges of points of view as their means of getting to grips with how to produce improvements, unburdened by data, analysis or insight.
I contend that that’s simply wasteful in a time where we have cheap computing power, masses of data at our fingertips, and well developed techniques with which to analyse data quickly and easily. All it takes is a bit of management focus and the willingness to marshal a few experienced heads in a room, combined with some analytical expertise. Could you really ascertain that a $2,500 investment in learning and development can drive a 1.1 point increase in overall customer satisfaction from a bland exchange of points of view?
Pulling the Levers to Produce Results
Just as an aside – one of the things I like most about this type of analysis is the discipline it enforces to really think through what matters: what’s the thing we care about in a particular situation that we’re really trying to understand: Reliability? Average costs? Net earnings? Customer satisfaction? Defects? This important thing – known in statistics as the ‘dependent variable’ – is the Holy Grail which we aim to unpack and explain.
And what are the things which influence the dependent variable? Thinking through the factors (termed independent variables) that impact this important thing is a useful and powerful practice, and doing it collaboratively has positive spin-off effects in boosting staff morale and team cohesiveness.
With a structured, disciplined process, and good knowledge of the business we’re investigating, regression analysis can provide a powerful new focus for an organisation which facilitates higher performance: higher customer satisfaction, lower costs, improved reliability ... you get the idea.
Ultimately, what we’re aiming for is a unified picture that sets out the drivers of performance – the levers to pull to gain a particular impact. By how much can we improve reliability by increasing maintenance? What's the impact on service quality and staff morale of our reform program? A tree diagram is a good way of depicting this logic; I’ve constructed a simple version here …
Management Applications
Here are some other management uses of regression analysis:
- I’ve used regression to determine which types of debris (litter/graffiti/newspapers/grime etc.) are most associated with customer perceptions of cleanliness
- marketers and trainers have used regression to evaluate the effectiveness of marketing and training efforts
- HR managers have used regression analyses to identify causes and trends in employee turnover and absenteeism
- where an organisation has multiple branches or outlets, regression is used to control costs by establishing which branch is the most efficient, and then applying its costs to the other outlets
- financial managers and accountants use regression to estimate which of their costs are fixed costs, which are variable costs (that is, they rise when the level of output rises) and what those cost levels actually are, and
- property sale prices can be estimated using location, house size, number of bedrooms, and features (swimming pool, air conditioning, fireplace...).
What area of your organisation’s performance could you improve with analyses such as these? To get you on your way, please contact me by return email or phone 0414 383 374.
I look forward to hearing from you.
Kind regards,
Michael Carman
Director I Michael Carman Consulting
PO Box 686, Petersham NSW 2049 I M: 0414 383 374
© Michael Carman 2013