CRACKING THE CODE OF CUSTOMER SATISFACTION - PART 1
Take a look at the graph below of customer satisfaction for a services organisation:
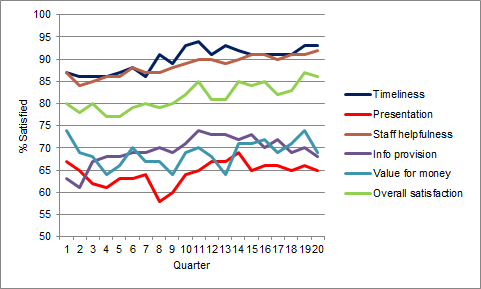
The data and organisation are fictitious, but this kind of data and presentation will be familiar to many organisations. Typically there’s a measure of the percentage of respondents who were satisfied or very satisfied with the overall service, which is regarded as headline customer satisfaction. This is then broken down into satisfaction with different service attributes: timeliness, staff helpfulness, value for money etc. – all of which is tracked over time (in this case quarterly, for 20 quarters).
All of which is fine. We see that overall customer satisfaction – the green line – is trending upwards, as are most of the individual attributes, albeit at different rates. There are different stories for some attributes: presentation (the red line) held steady, while information provision (purple line) peaked halfway through the period and then tapered off.
So where does this take us?
Over and above this high-level story, which suggests that things are tracking OK but we need to keep an eye on presentation and information provision, we’re still left wondering about what’s driving what. Are any of these attributes linked to each other, and which ones are most closely linked to overall customer satisfaction? Is there an underlying signal that we can winnow out from the noise of the individual quarterly gyrations of individual attributes? Is there anything else about this service’s customer satisfaction to be gleaned from this data?
Many of you who know me will have already guessed my answer to these questions.
I’m a firm believer that there are mountains of data available, the greater part of which hold nuggets of valuable information which remain undetected, unanalysed and hence under-utilised. Moreover, there is an armoury of powerful techniques which can be applied quickly to yield new insights that can lead to improved performance and results.
I would start exploring this data, with a view to ‘cracking the code’ of this service’s customer satisfaction, by using a correlation matrix.
A correlation matrix shows the degree of association between different variables, such as customer satisfaction attributes. Or to put it another way, correlation shows the degree to which variables move jointly. Correlations can range between -1 and 1: -1 is a perfectly negative relationship – one thing goes up and the other goes down. A correlation of 0 means there is no relationship at all and the factors are unrelated to each other. A correlation of +1 means the factors move perfectly in unison in the same direction.
Generating a correlation matrix is dead easy – you don’t even need specialised software. Using the Data Analysis add-in from Microsoft Excel (Data > Data Analysis > Correlation) yields the following table, which shows the correlations between each of the individual satisfaction attributes, as well as overall customer satisfaction:
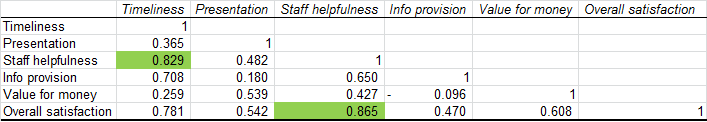
Note that the diagonals all have correlations of 1, since each attribute is shown in the first row and column and hence the diagonal represents each attribute’s correlation with itself (which must be +1).
At a glance, we now have an empirical, evidence-based picture of how our customer satisfaction attributes relate to each other, filtered from a tangle of data.
I’ve focused where the correlation between attributes is higher than 0.8, and I’ve highlighted those cells in green. (Conditional formatting is a quick and easy way to do this if you’re familiar with spreadsheets).
We can see that the attribute with the highest correlation with overall customer satisfaction is staff helpfulness (correlation: 0.865). and we can also see that another attribute – timeliness – is in turn linked with staff helpfulness (correlation: 0.829).
So we can form a coherent picture of linked attributes that creates a ‘trail’ of evidence leading to the thing we’re most interested in: overall customer satisfaction:
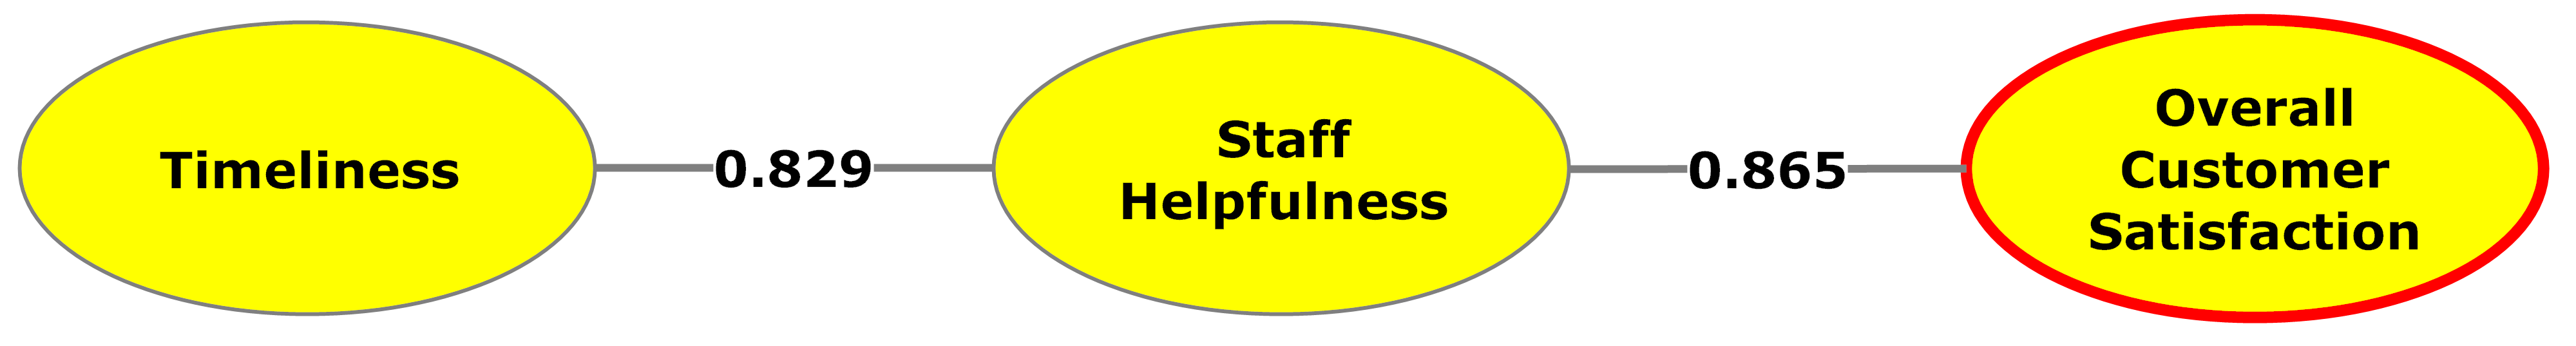
We’re now guided, on the basis of the data, to ensuring our staff are particularly focused on the direct helpfulness aspect of their service delivery, especially as it relates to timeliness.
And isn’t it interesting that had we simply focused on those attributes which were trending downwards in the first graph above we’d be looking instead at information provision, rather than staff helpfulness and timeliness? A key learning here is that just because an attribute is trending downwards doesn’t necessarily mean that satisfaction is jeopardised: that attribute may not be tied to overall customer satisfaction.
And it’s only through an analysis such as this that we’d be able to determine that.
Once the data is collected and entered into a spreadsheet, an analysis like this can be produced in a matter of minutes: quite a return from a short investment of time!
If you’d like assistance ‘cracking the code’ of your organisation’s customer (or employee) satisfaction please contact me by return email or phone 0414 383 374.
In next month’s newsletter we’ll dig deeper into the same data, to gain an even more nuanced and precise picture of how this service can use smart analysis to boost its customer satisfaction performance.
Kind regards,
Michael Carman
Director I Michael Carman Consulting
PO Box 686, Petersham NSW 2049 I M: 0414 383 374
P.S. If you’re still not convinced of the impact that analysis and evidence-based decision-making can have for organisations, you might want to go to http://www.smh.com.au/technology/technology-news/munching-data-how-google-solved-its-mm-problem-20130902-2szyv.html to see how Google used high-powered data analysis to reduce its staff’s chocolate consumption and encourage healthier eating.
P.P.S. Smart analysis guides you towards the key areas to focus on for performance improvement; simulation-based learning techniques teach you how to actually improve them. The most recent issue of Training & Development magazine features an article of mine on simulation-based learning; click here to read the article. To organise simulation-based training for your organisation, please email me at info@mcarmanconsulting.com or phone 0414 383 374.
© Michael Carman 2013