What really gets you in when you do business analysis is seeing key aspects of an organisation’s situation unfold before your eyes. What was hazy and vague starts to assume form; seeing a pattern where none was visible before.
This pattern recognition is powerful and very useful for management. I am firmly of the view that such analyses provide the hooks for serious strategic deliberation and goal-setting. Having an informed, evidence-backed view of the world provides the crucial context for setting priorities.
In this and the next few e-newsletters I will be running a series titled Smart Data which will show how to use analysis to find the drivers of performance and boost results across many areas including:
• enhancing staff productivity,
• increasing revenues,
• reining in unit costs,
• retaining customers, and
• shoring up member numbers.
This month’s e-newsletter focuses on how to use smart analysis to improve asset performance: the condition and reliability of long-lived physical assets including buildings, pipelines, roads and pavements, track, vehicles, culverts etc.
An Ounce of Prevention…
Everyone knows that preventative maintenance is key to maintaining assets and lengthening their life: that an ounce of prevention is worth a pound of cure.
Easy in principle. What’s more difficult however, is knowing how much to spend on maintenance. And given that these assets have economic lives of up to 50, 80 or even 100 years, it’s not only a matter of how much to spend, but when in the asset’s life you spend it. Deferring maintenance for only one year will probably not have much impact, but for how long can you defer? And if maintenance is deferred for too long, does this decision come back to bite you later in the form of higher maintenance costs or lower asset reliability?
These are tough questions to answer, especially if you have a number of different types of assets to manage. Many asset managers deal with this by simply attending to assets as they fail, a protocol referred to as ‘fixing the worst first’.
Analytical Answers
Fortunately, as with many types of problems, the data can really help here (an ounce of analysis is better than a pound of haziness?)
The data can be used to derive an analytical tool with the cheery title of a deterioration curve (or decay curve). A deterioration curve plots how an asset’s condition deteriorates over time: it shows that in the early years of an asset’s life its condition only deteriorates mildly; but after a certain tipping point the deterioration worsens markedly. A deterioration curve for a particular asset looks something like this:.
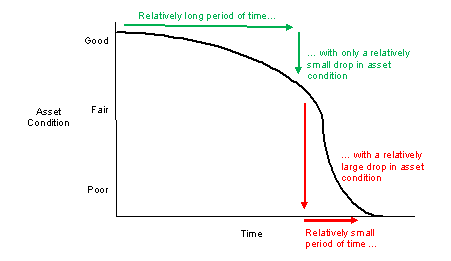
Key question: Where are your assets on their deterioration curve?
Towards the end of its life, the worsened rate of deterioration means that costs to rehabilitate or renew the asset are much higher. Preventative maintenance forestalls this deterioration; it slows the effect of time:
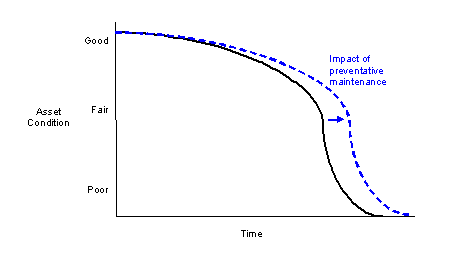
Key questions: How much extra time is preventative maintenance buying you before your assets fall off the deterioration cliff? And if your preventative maintenance is being cut back, how much extra time have you foregone? Do you know the long-term cost implications of a short-term cut to your maintenance budget?
Depicting Deterioration
So the deterioration curve is a key analytical tool; it’s a map that helps guide decisions on how much to spend on maintenance and when.
How do you derive a deterioration curve? If you have a portfolio of assets under your management, here’s how to develop one for a given asset type:
1. assimilate data on asset condition (such as a condition rating, or a roughness index in the case of roads) and match it to the age of the asset
2. plot these against each another in a scatter-plot, where each dot represents one rating or observation. One particular asset may have several dots depending how many times its condition was rated
3. use regression analysis to derive the line of best fit. You’ll end up with something that looks like this:
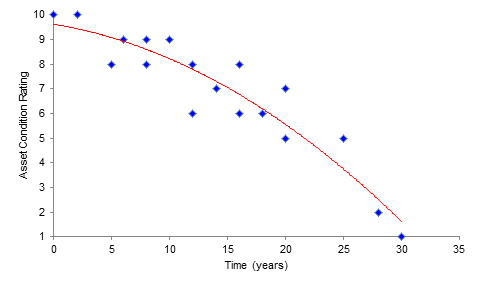
Of course, this line will have some repairs and maintenance expenditure embodied in it. If you have data on repairs which can be cross-referenced with the age and asset condition data, you can do some clever regression analysis that allows you to gauge how much extra time or improvement condition a certain amount of maintenance spend will buy you.
Once you have that, you can make informed decisions about how much to spend and when, depending on your maintenance budget. And you’ll have a solid basis on which to bid for greater funding.
How much better is that than ‘worst first’?
* * *
If you would like assistance developing deterioration curves for your assets, or to discuss any of the above, please call me on 0414 383 374 or contact me by return email.
Regards,
Michael Carman
Director I Michael Carman Consulting
PO Box 686, Petersham NSW 2049 I M: 0414 383 374 I
Reference: Ugo Feunekes et. al ‘Taking the Politics Out of Paving: Achieving Transportation Asset Management Excellence Through OR’ Interfaces January–February 2011 pp.51-65.
© Michael Carman 2014