FOUR WAYS TO USE ANALYTICS TO MAP AND IMPROVE ORGANISATIONAL CULTURE
Analytics can be harnessed not only for directly commercial applications such as optimising pricing, scheduling truck routes, or assigning jobs to machines; it can also be used to support efforts in ‘fuzzy’ areas of organisational life such as improving culture, values, and teamwork.
Here are four applications of analytics that can aid efforts to improve aspects of organisational culture such as teamwork and motivation.
1. Diagnosing Culture
To improve culture you need first to pin it down and understand how it’s looking – culture performance if you will.
How do you find out how satisfied employees are? How motivated? Or how well teams are working? By asking them!
Surveying staff on these aspects of organisational life might not seem as rigorous as deriving information from experiments in the natural sciences, but it’s one of the few ways of accessing the interpersonal reality of work. It might seem subjective (and in a very real and appropriate sense, it is) but results can meaningfully be compared over time, or between organisational units, or both. Have overall levels of satisfaction improved over recent years? Do people feel the organisation is more open? Which divisions are the most cohesive? A culture diagnostic provides answers to these questions.
A proper culture diagnostic will go beyond the typical staff satisfaction survey or culture questionnaire because each question will be tagged to a specific dimension of organisational climate. For example, a question about whether there are ‘in’ groups among staff may be part of a suite of questions that jointly indicate the level of staff conflict in the organisation. Taken together, the responses provide a coherent picture of organisational climate across predetermined aspects such as openness, staff autonomy, management support, and so on.
Pre-existing survey instruments are available which can be used to measure aspects of culture and climate, or you may choose to develop your own diagnostic instrument based on your organisation’s own Mission and Values statement etc.
2. Mapping Culture
The culture diagnostic is useful for bringing to light important aspects of an organisation’s cultural functioning, but that’s only the start. Results can be unpacked by division or operating area, enabling us to identify particular ‘problem areas’ or ‘stars’.
But we can move beyond a simple disaggregation of results by organisational unit: responses can be analysed to find patterns between different aspects: does staff autonomy move in sync with staff satisfaction? Is organisational support for staff associated with reduced staff conflict?
Data mining techniques can be used to find patterns in what would otherwise appear to be a kaleidoscopic morass of data: this is one of the most powerful and exciting applications of analytics.
Once you’ve found these relationships they can be plotted in a diagram – a culture map – that looks something like the one below (which is indicative, for purposes of illustration only). The ‘tile’ for each dimension of culture can also be colour-coded (green, amber, red) to show its ‘health’.
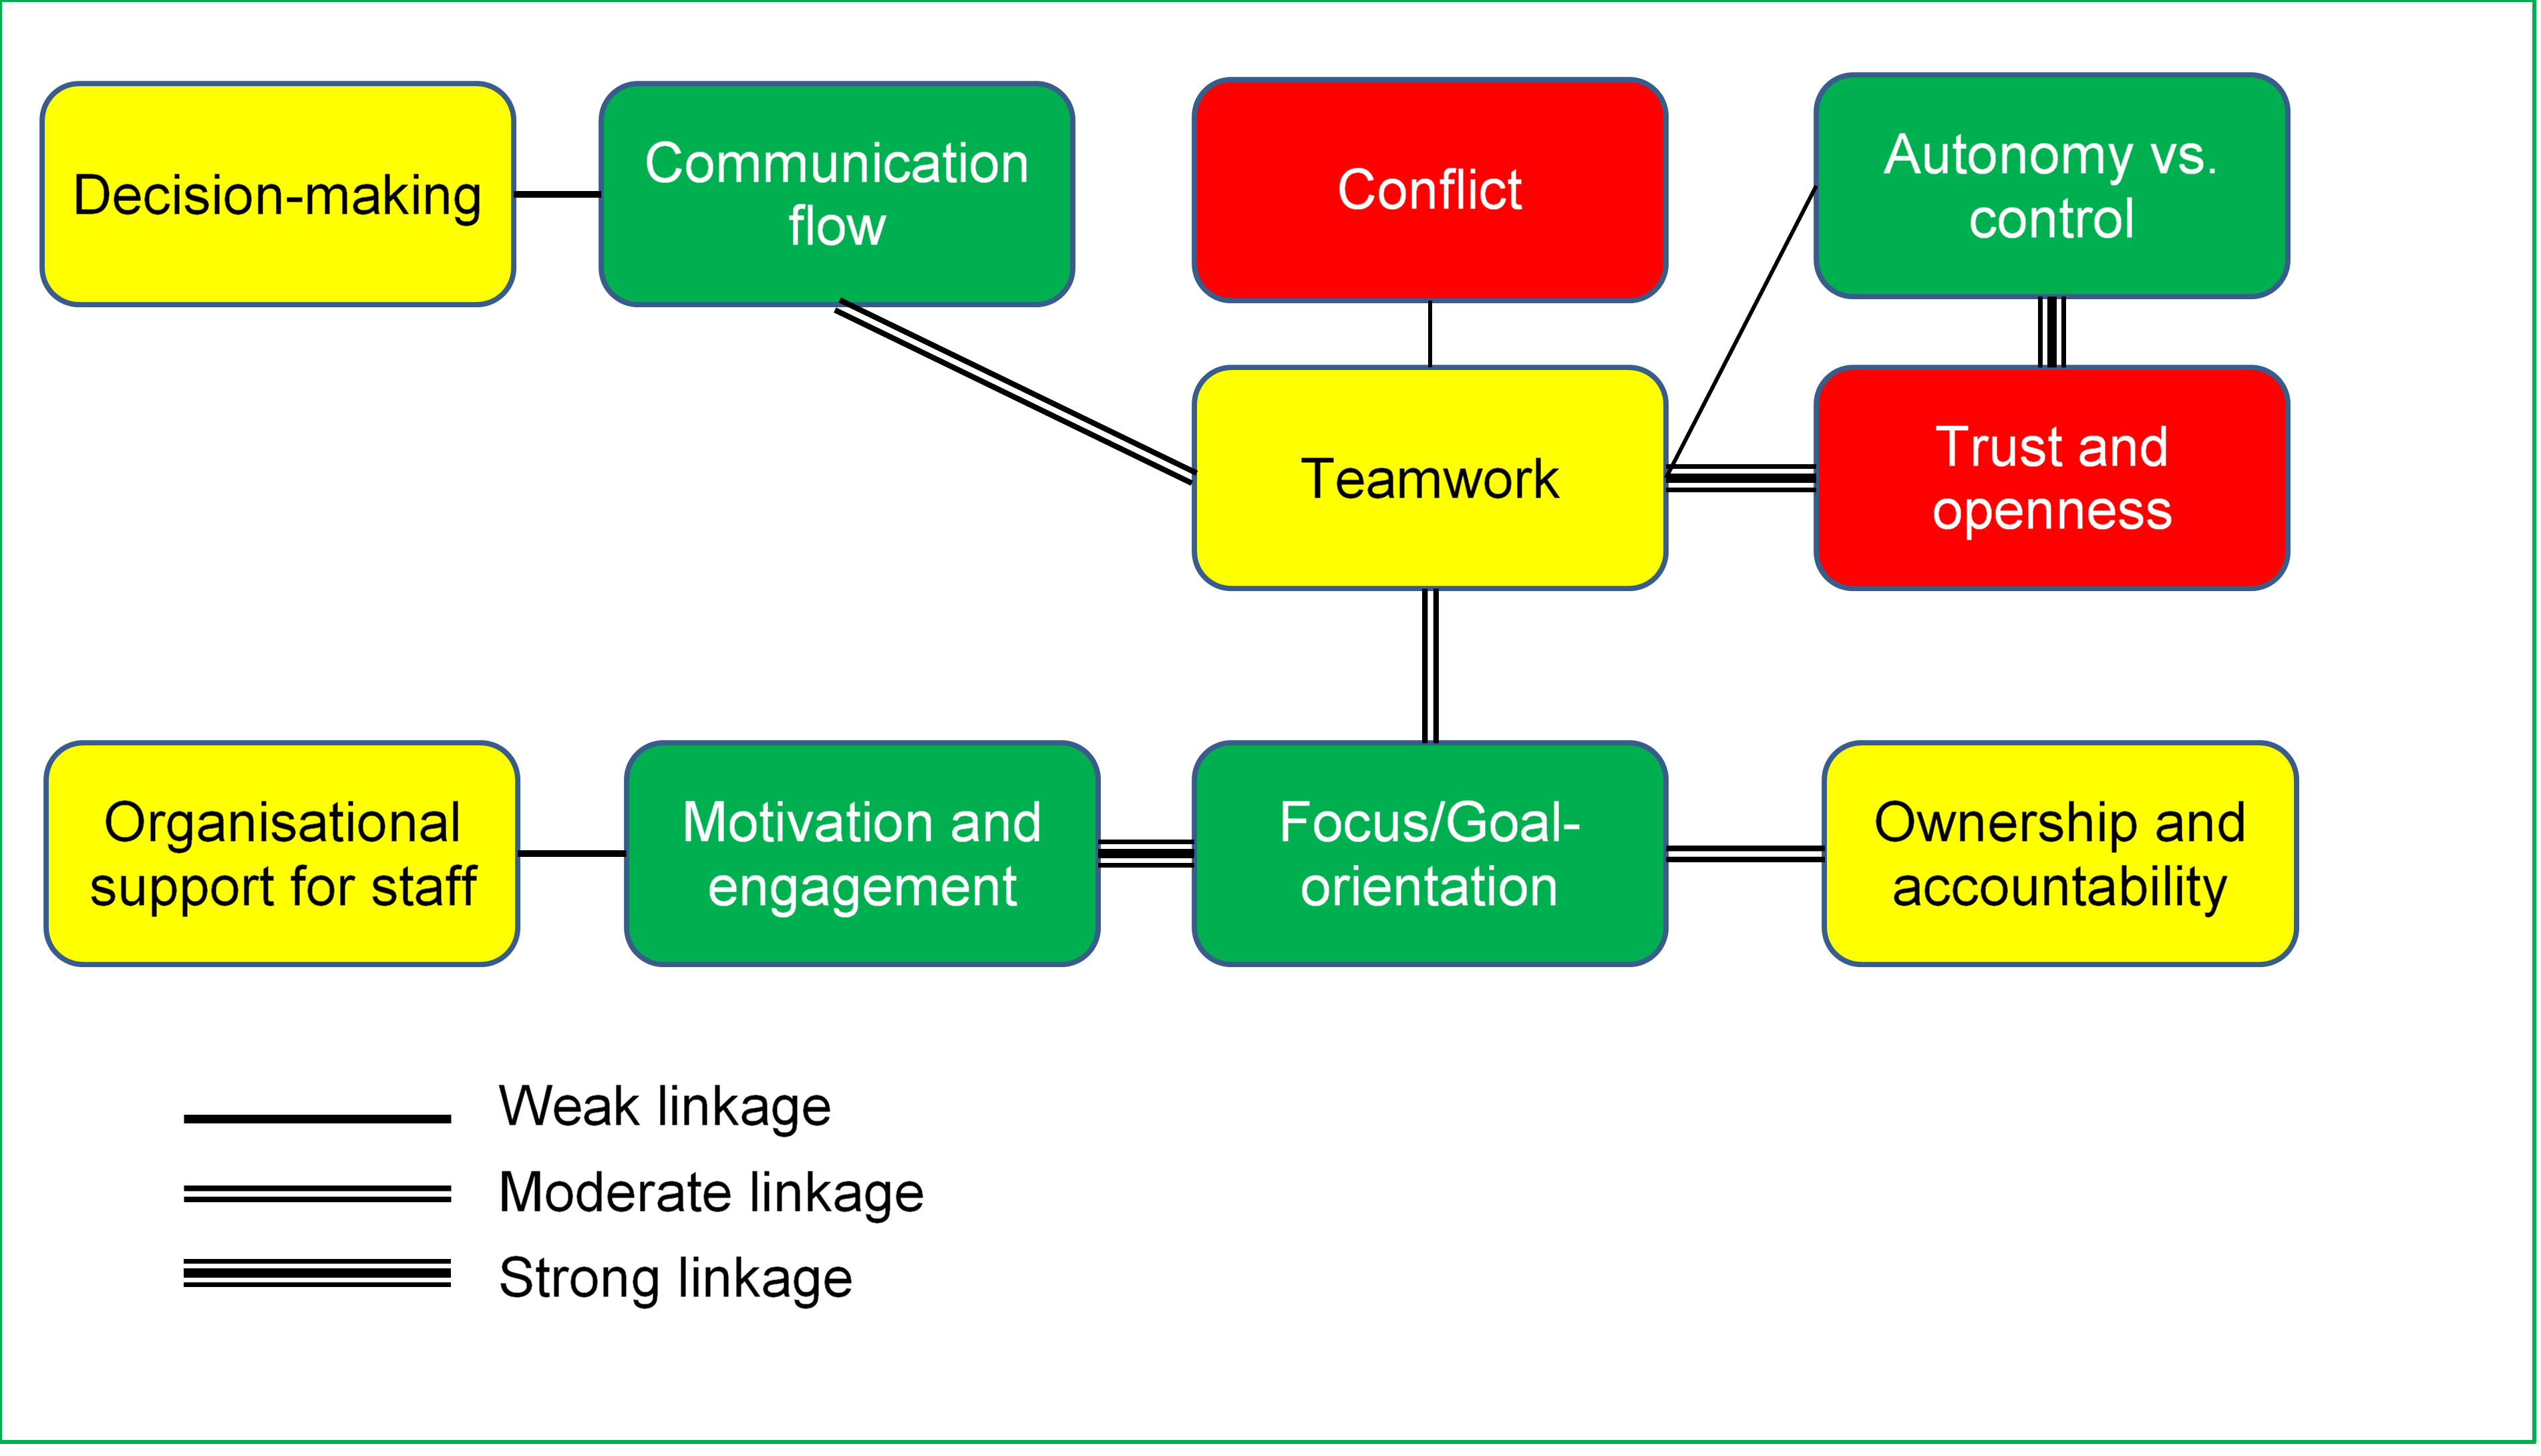
This analysis shows how aspects of culture cluster together; quantitative techniques reveal the strength of the relationship (depicted in the above graphic by the size of the connecting lines); and statistical tests show the likelihood that the relationships we see are due to chance (a ‘fluke’).
3. Identifying Culture Drivers
This kind of diagram shows the critical ‘nodes’ in the network of attributes that make up an organisation’s culture. With these identified we start to get an idea where to focus efforts to improve culture. In the example above, Teamwork and Focus/Goal Orientation are principal nodes so these make sensible starting points for efforts to improve culture.
Some culture diagnostic instruments provide for respondents to not only indicate actual responses, but also ideal responses. The dimensions of culture with the largest gaps between actual and ideal measures provide another means of identifying those areas on which to focus first.
If there is a ‘headline’ measure such as overall staff satisfaction, in addition to various other attributes (say, work-life balance, challenge of the work etc.) the latter can be correlated with the headline measure to see which is most closely associated with it – in effect a driver for overall staff satisfaction.
Drawing other aspects of performance (such as financial or operational aspects) into the equation means the picture can be enriched further: was last year’s increase in revenue associated with an uplift in staff motivation? Did we see any link between the new performance management system and focus/goal orientation?
Quantifying and analysing culture, and linking it to ‘hard’ aspects of organisational functioning, is one of the most powerful (and under-utilised) sets of management levers available to executives and decision-makers.
4. Test-and-Learn: Measuring the Results of Culture Experiments
The three previous applications deal with getting a handle on culture as it is. But what about specific efforts to improve culture – can analytics help here?
I am a strong advocate of the use of test-and-learn methods: small-scale temporary experiments run to garner market and operational information. Typically these relate to testing different kinds of marketing copy, or customer offers, or price points. But they can also be used to pilot new ways of working to improve culture. What if new communication mechanisms were trialled which changed the frequency of communication? Or an experimental protocol on how meetings are to occur was tested? Or two different values and behaviour codes were trialled and compared? Very few organisations have the discipline to experiment in this way. (And that says something in itself … simply having the intentionality to proceed in such a programmed way represents a de facto improvement in culture…).
All of which is fine, but what does this have to do with analytics?
The point of running an experiment is to test a hypothesis, and you do this by gathering data from test and control groups, analysing it and then accepting or rejecting the hypothesis. In a test-and-learn environment where the hypothesis centres on the effectiveness of a particular initiative or change, statistical techniques are used to analyse experiment results to determine the success or otherwise of the initiative.
Just remember: if your experiment is being run as a before-and-after scenario, make sure you take baseline measures to compare against the results of the initiative. And if you’re running an isolated experiment scenario, ensure you have a control group as a comparator. (Gary Loveman, former CEO of US gaming giant Caesar’s Entertainment Corporation – well known for its use of analytics and test-and-learn – quipped that there were three ways to get fired from Caesars: theft, sexual harassment, and running an experiment without a control group).
* * *
Using analytics techniques to diagnose and improve culture is an area of strategic management which is in its infancy, yet it holds great promise. Its potency resides in bridging the ‘hard’ discipline of analytics with the ‘soft’ but critical concerns of culture, values and teamwork.
How’s your organisation’s culture looking? Couldn’t you use a dose of analytics to improve it?
Warm regards,
Michael
Director I Michael Carman Consulting
PO Box 423, Croydon Park NSW 2133 I M: 0414 383 374
Reference:
Benjamin Schneider (1997) ‘Experiencing Organisational Climates’ in Donald D Bowen et. al Experiences in Management and Organisational Behaviour John Wiley & Sons, pp.413-416.
© Michael Carman 2017