HOW MUCH CLIENT IMPACT DOES AN EXTRA DOLLAR OF SPENDING HAVE?
In a recent newsletter (Four quick analyses for improved operations and customer satisfaction) I discussed how powerful analytical techniques could be applied to solve problems and improve business results. In this and following newsletters I’ll provide case studies and examples of these analytical techniques in action.
* * *
How much impact does an extra dollar of spending have on a client?
We can get a nice take on this from vocational education and training (VET) courtesy of the Productivity Commission.* Utilising funding and student survey data from the 2012 Report on Government Services it’s possible (in fact, quite easy) to explore whether there’s a relationship between spending and client outcomes. From there we can assess the strength and direction of that relationship.
To cut to the chase: every extra dollar per hour of public spending on vocational education and training is associated with an extra ¾ of a percent in student achievement. The graph below shows the story:
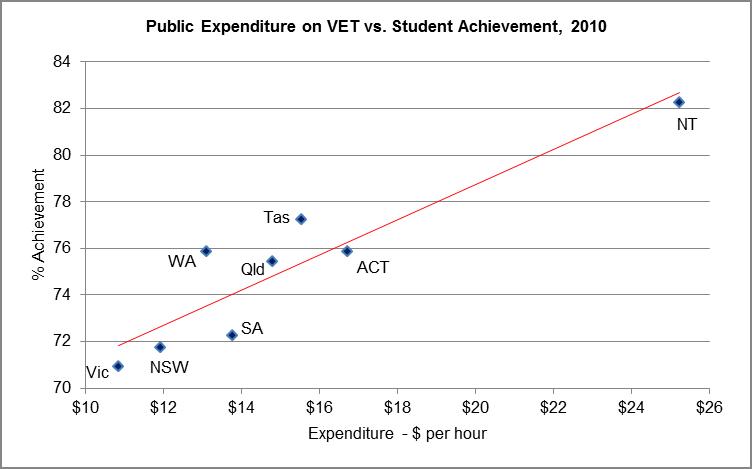
source: analysis based on data in 2012 Report on Government Services - Chapter 5 – Vocational Education & Training; www.pc.gov.au/gsp/rogs/2012
We’ve plotted each state and territory's spending on VET (on the horizontal axis) against the percentage of graduates who reported that VET courses helped them achieve their main reason for undertaking training (vertical axis). Each state and territory has its own ‘dot’ expressing their particular combination of spending and student achievement for the year in question (2010). There’s an obvious trend upward and to the right: the more spent on VET, the higher the proportion of graduates who reported achieving their reasons for undertaking training.
We can draw a ‘line of best fit’ through the dots (the red line in the graph above) which represents a kind of average or summary of the relationship. And the slope of that line expresses the change in the relationship between VET spending and student achievement (remember your Year 9 maths teacher talking about ‘rise over run’?).
In our VET case, the slope is 0.75 – in other words, every extra dollar of public spending is associated with an extra three-quarters of one percentage point of students accomplishing their reasons for VET.
How strong is the relationship?
The more tightly packed the dots around the line, the better the fit. If the dots are just a random scatter then the line of best fit won’t convey useful information. The degree to which the dots are packed around the line is given by a measure with the (daunting) title of the ‘coefficient of determination’ (or r-squared) which can range anywhere between 0 and 1. If the dots are a completely random scatter, the r-squared is zero: the more tightly packed the dots, the closer the r-squared is to 1. In our VET case study, the r-squared is 0.85, which is high. So there’s a tight relationship between VET funding and student achievement.
Opening up the issue
But this is just the start. From here we can…
-
run a test to assess the chance that the relationship we’re seeing is a fluke (in our VET case, this chance is less than 1%)
-
check whether other things are related to funding (such as student or employer satisfaction with VET)
-
explore whether there are other drivers of student achievement (perhaps student participation rates)
-
see if we can get an even better line of best fit – and a more nuanced understanding of the relationship between funding and student achievement – by using a curved line rather than a straight line, and
-
look at how the relationship between funding and achievement has moved over time, in addition to a snapshot across jurisdictions at a point in time.
And that’s just for starters!
Countless applications
I’m convinced that there are many, many applications of this technique for businesses, government and not-for-profit organisations, and that the power of this technique (which is known as regression analysis) is massively under-utilised.
Here are some questions you can explore with regression analysis in your organisation:
-
how much would it cost to increase customer satisfaction by one percent?
-
how much would revenue increase if prices were lowered by 5 percent?
-
by how much can I reduce my costs before I start reducing quality or reliability to below-target (or unacceptable) levels?
-
could we reduce spending and still meet our targets for quality or satisfaction?
-
how much does demand increase when we run an advertising campaign?
-
how much do our greenhouse gas emissions increase as our organisation grows?
Two particularly fertile areas for regression analysis are in setting meaningful, evidence-based targets for Key Performance Indicators (KPIs); and to ‘chain’ together different operational decisions into a coherent, fact-backed unit of management (eg. if we add more staff, by how much will customer waiting times reduce? And if waiting times reduce, what impact can we expect to see on customer satisfaction?). Regression analysis can therefore become a key tool of management decision-making, and a vital input into strategic planning processes.
Enhanced clarity and teamwork
In addition, the process of clarifying what to test and what might be related to what is itself a powerful discipline and can lead to improved management clarity, teamwork and unity of purpose.
I would very much like to assist your organisation gain this clarity, and the related benefits of evidence-based analysis. Please contact me on info@mcarmanconsulting.com or phone 0414 383 374 to get the process underway.
I look forward to hearing from you soon.
Regards,
Michael Carman
Director | Michael Carman Consulting
PO Box 686, Petersham NSW 2049 | M: 0414 383 374 | W: www.mcarmanconsulting.com
* More correctly, the Steering Committee for the Review of Government Service Provision, for which the Productivity Commission acts as the Secretariat.