How Analytics Supports Community Care … and Five Things We Can Learn From That
Every so often I undertake research on my own behalf to promote the analysis of, and improvement in, performance in the government and not-for-profit spheres.
The latest such research investigated whether community based care for patients with mental health issues in NSW provides improved patient outcomes.
A ‘Hard’ Analytics Finding in the Social Services and Community Care Sector
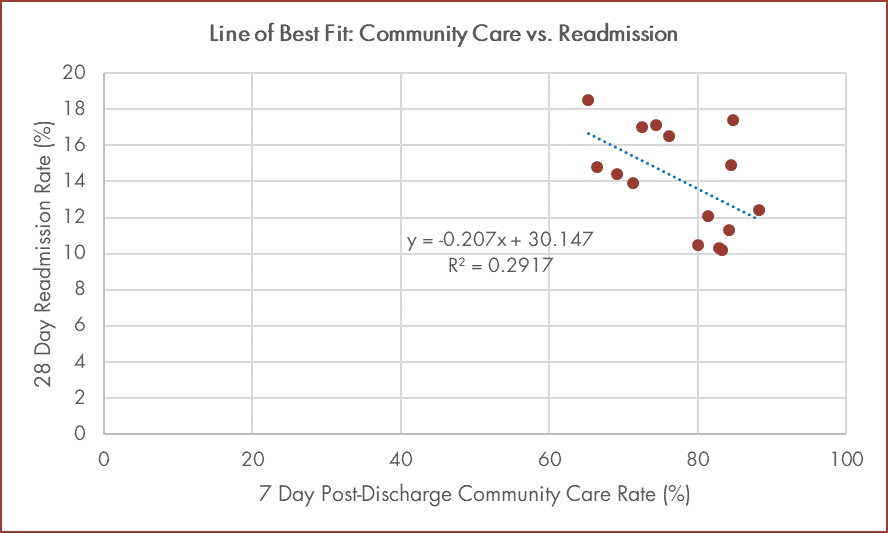
The research found that post-discharge community-based care does indeed improve patient outcomes as measured by hospital readmission rates: a 10 percentage point increase in community care is associated with a 2.1 percent point reduction in hospital readmission of mental health patients, and the link is statistically significant (at the typical threshold of 5%).
The graph below tells the story: each dot represents one of the 15 NSW local health districts (LHDs) plotted against the 7 day post discharge community care rate (horizontal axis) and the 28 day readmission rate to hospital (vertical axis).
This is a prime example of analytics being applied in a human context for a social end.
You can read the full research brief (9 pp.) here. I have also provided the research to the Productivity Commission as a submission to their inquiry into Mental Health.
Five Other Observations
Aside from the substance of this particular issue, there are – taking this situation as a whole – a range of other observations we can make: here are five of them…
1. Significant Business Value Can Be Mined … Close to the Surface
The first is that there is hidden value lying within datasets which, if uncovered, can shed light on business situations, provide guidance on the drivers of performance (in this case, rates of community care) and establish relationships between vital business variables. This is of use in running a business or organisation, showing the impact of changing various inputs, and enabling management to filter down to the vital few factors needed to accomplish results. Moreover this value is relatively easily uncovered; put another way, these nuggets of gold are not buried very deep.
2. Much Good, Clean Data is Freely Available and Readily Accessible
The data on mental health on which the analysis of community care was based was sourced from the NSW Health annual report for 2017/18 (Table 2 in Appendix 4 for those who wish to check). The data is clean, in the public domain, and readily accessible at no cost.
There is a plenitude of such data available from annual reports, Audit Office reports, reports of Parliamentary inquiries, Productivity Commission reports, the AIHW, and the OECD, to name a few. There is a wealth of good data only a click or two away, which can yield valuable business insights and help establish where critical business relationships exist (refer number 1 above). And that’s only from the publicly available data! Imagine what combining the data in your organisation’s typical management reports, sets of financial accounts, operations reports, marketing information and HR data could yield…
3. Business Knowledge, A Hypothesis or a Guiding Question Are Necessary
The relationship between community care and hospital readmissions was prompted by seeing both these data items in various documents which were reported as part of the NSW Health Performance Framework (which sets out NSW Health’s performance requirements of the LHDs). These are the only two data items relating directly to mental health.
Yet a moment’s thought suggests that there is a sequence between community care and hospital readmissions: one (community care) could reasonably be expected to impact the other (hospital readmissions). They are not both the end point of an episode of care for a mental health patient. Thinking through the possible pathways in and out of the care system for a patient suggests a chronological sequence and possible causality – between only two performance indicators! – and this is enough of a prompt to initiate some meaningful analysis.
My point is that applying some understanding of the business – and poking around readily available data (refer number 2 above) – provides fertile ground for developing very useful avenues for analysis. It may not be the full-blown hypothesis testing of the scientific method with test and control groups (although it doesn’t have to be so terribly far from that…) but it will at least be a guiding question, a roughly hewn hypothesis which gives a direction for analysis.
Sometimes the process of finding these guiding questions may take the form of what I term ‘structured faffing around’ but it is no less productive as exploratory analysis for that. And knowledge of the business is key: analysis builds on the knowledge of the business and helps refine and articulate that knowledge, rather than progressing in its absence. (Handy hint: this is a key clue in gaining business buy-in to and operational stakeholder engagement for an analytics project in an organisation…).
Our application of analytics is only as good as our understanding of the arena in which it is to be applied. The better our business knowledge and the fresher our thinking, the better our hypothesis or guiding question, and the higher value the analytical effort will yield.
4. Analytical Methodologies Are Well-Developed and Software is Freely Available
It’s not only data which is freely available (refer number 2) the techniques and software with which to analyse it are also easily and freely within reach.
The analysis of mental health data was a simple regression performed in Microsoft Excel and checked, with a couple of other tests run, in freeware called Gretl. While there’s been much ink spilt lately about analytics, big data, data mining and the like – as if they were all recent developments – regression analysis itself is over 130 years old (Francis Galton first coined the phrase in 1886, utilising concepts developed in the early 1800s) and the other workhorse of analytics (optimisation techniques based on linear programming) were developed during World War 2.
Similarly, anyone with Microsoft Excel on their computer has the ability to perform a vast array of statistical or optimisation analyses, and there are powerful statistical packages (notably R and Gretl) which are available for free with large amounts of helpful documentation.
While some knowledge of stats and maths is required for these techniques to be properly applied (which is where a friendly consultant comes in…) no one can complain that there were no techniques to use, or that the kit required to perform the analysis was unavailable.
5. Analytics Doesn’t Reduce People to Numbers or Equations … Equations and Numbers Can Be Used to Improve People’s Lives
From time to time, when analytics is applied to human issues (especially in social services) you hear the complaint that ‘people are not numbers’ and ‘you can’t reduce a real human being to an equation’.
While both of those statements are true, neither means that analytics shouldn’t be applied to areas of human concern. I take issue fundamentally with any notion that social services (or any other area of human endeavour) should be out-of-bounds for informed, properly undertaken analysis.
The graph below shows the same data that was seen in the graph above, but without the line of best fit and summary diagnostics, and with each LHD identified.
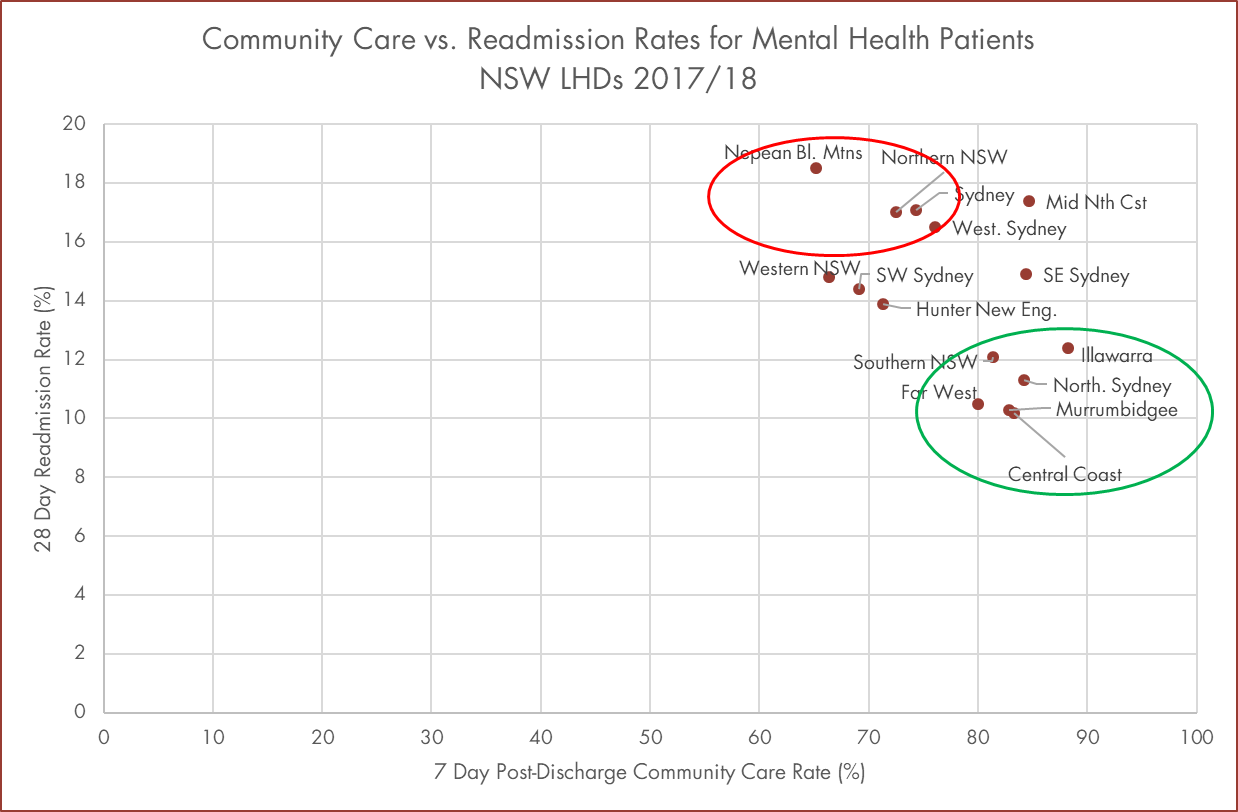
The fact of the matter is that those patients with mental health issues in the LHDs in the top left hand section (circled in red) will, on average, have a rougher time of it than those in the bottom-right hand section (circled in green): they are less likely to receive post-discharge community care, and more likely to be readmitted to an acute hospital inpatient facility. A patient with a mental health issue in Penrith had 18% less chance of receiving community care than a mental health patient in Gosford, and was almost twice as likely to be readmitted to an acute psychiatric inpatient unit.
These are real health outcomes affecting real people. The math – far from reducing people to numbers or treating them as fodder for an equation – in fact creates a robust means of crystallising real peoples’ situations and managing these more effectively (eg. using increased community care to lower hospital readmissions).
Analytics is not anathema to real people and their situations – it is a powerful means of bringing those situations into sharper relief, understanding what can and can’t improve those situations, and providing greater support, and reduced pain and discomfort, for the people in those situations.
That’s a far cry from reducing real people to a number or an equation.
* * *
You will be hearing more from me in coming months about how analytics can be powerfully applied in a range of settings to unpack and improve performance.
In the meantime, I would be delighted to assist you with this in your organisation – please contact me on 0414 383 374 or by return email and we’ll get started…
Warm regards,
Michael

© Michael Carman 2019